
A-Z British Trees A3 Risograph
£ 35.00
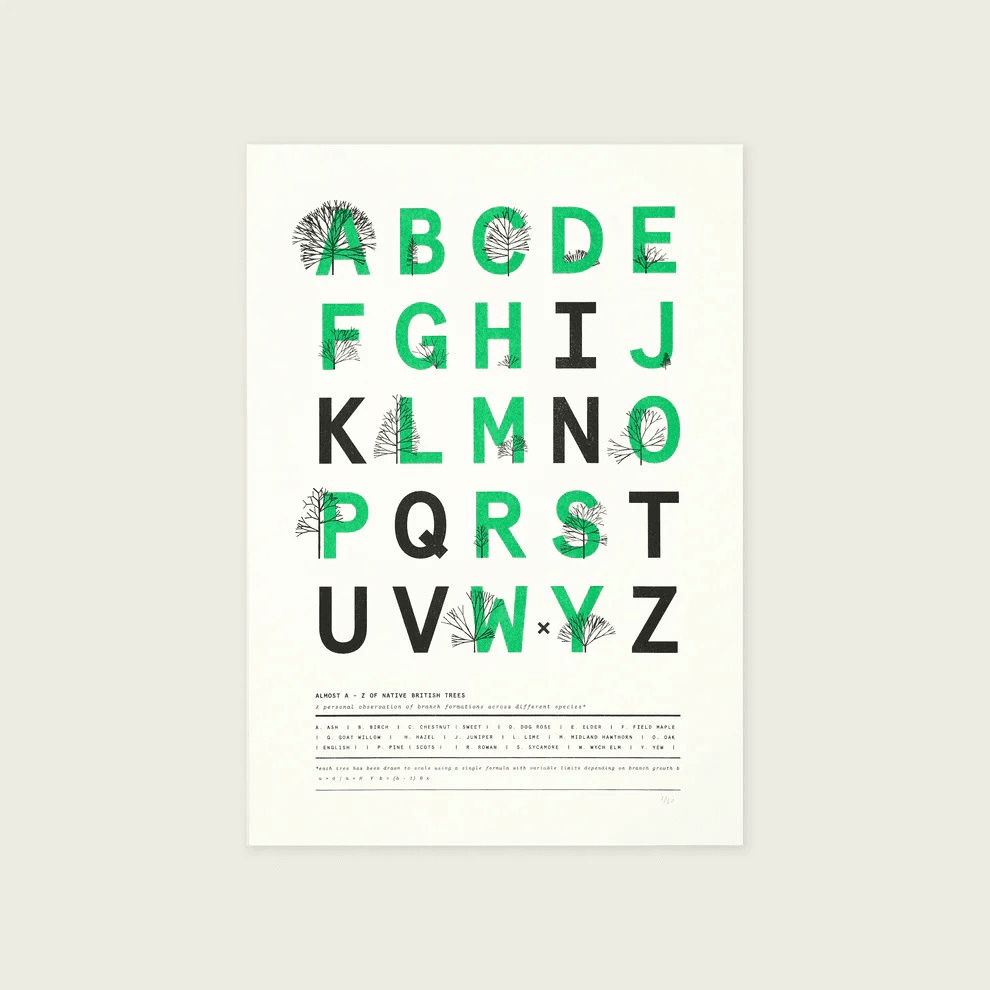
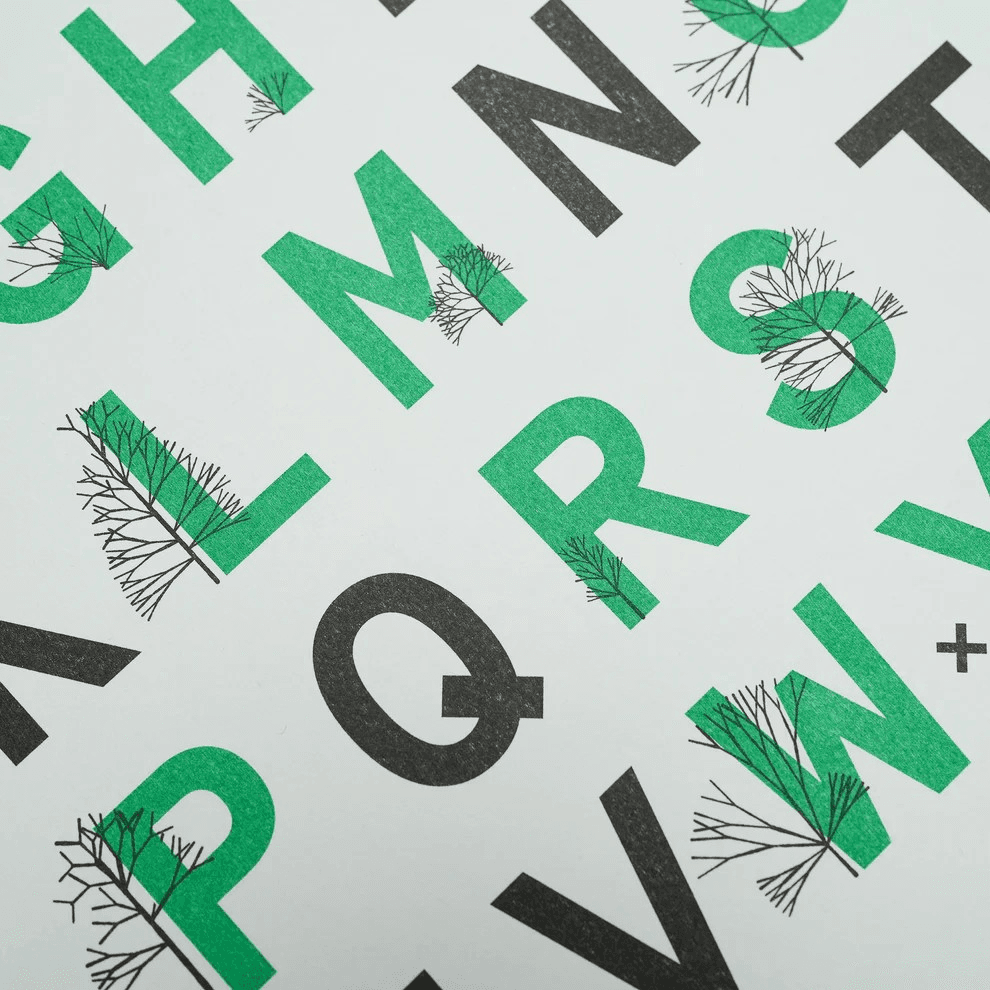
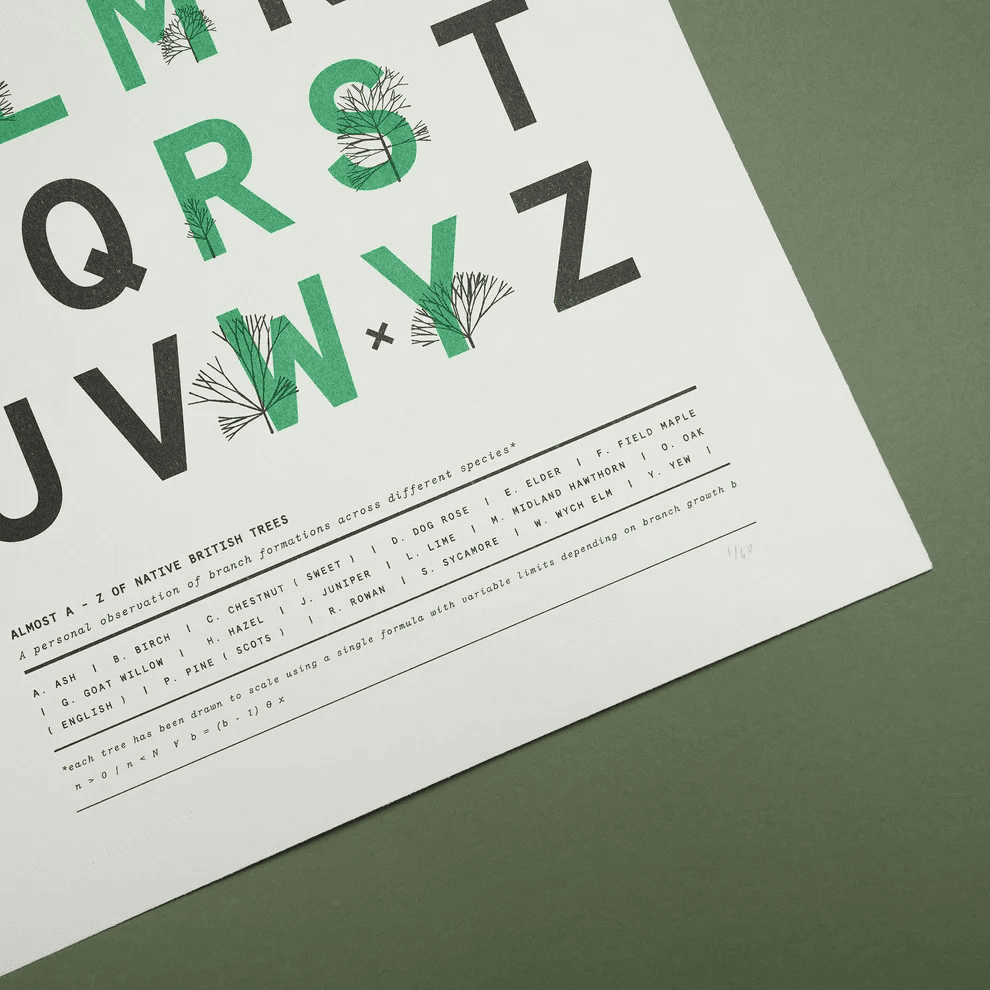
Drawing native British tree species using one single formula.
All of Ploterre’s work incorporates data. And its through data that they’ve learnt so much about the natural world.
But before they’re able to create their prints from the data they’ve researched. They first have to be able to draw with formulas.
This piece gives a glimpse into this earlier stage. Where they’ve created a single formulas to draw every native tree species in the British Isles.
An almost a – Z of trees.
Specification
297mm W x 420mm H (A3)
2 Colour Limited Edition (of 60) Risograph
175gsm Natural Paper made in Yorkshire
Details
At the mention of data, thoughts of computers and cold, hard facts tend to crop up. But data is really just a series of observations. When the MET office began, ‘data’ was a series of observations and barometer readings by local fisherman. Even now, NHS ‘data’ is just a personal diagnosis from one specialist.
And to view data in observations, personalises the word. It makes it less unfathomable and more relatable.
And so to drawing with formulas.
Normally when they draw, they have to study the subject. For the case of the tree, they see where a particular branch curves or joins and whether leaves are symmetrical.
But when they have to translate this into a formula. they realise how little they’ve really LOOKED. When do the leaves begin and stop along the branch? Do the branches taper? At what angle do certain tree branches grow?
And so using data, makes them look much deeper. And ultimately, understand much more.
This print is the result of that looking. Where each tree has been drawn to scale. And each tree has been drawn using a single formula.
Available Framed
Only 2 left in stock